Google Charts for Graphs
Last week I wrote a blog post about "Why Learn JavaScript", one of the main reasons for learning and using JavaScript is the fact that it is the de facto standard for interactive web frontend.
To that end, it would be interesting to see an example of it. In this post, we will use the Google Charts JavaScript Library to make some network graphs. This is actually part 1 of the 3 parts blog post that I plan to write about JavaScript. The second part would be about the Vue JavaScript Library and the third would be combining the two together.
What is Google Charts
What are Google Charts and why do we want to use it? Google Charts is a JavaScript library that allows us to render graphs directly inside of the client's browser. What does that mean? Usually, when we need to show a graph, like the pictures you see in my blog post, they are served from the server. It can be the web server you are accessing the file from or from a CDN server that cached the image from the server; but the premise is the same, the image is stored somewhere to be downloaded. As such, there would be some latency in downloading the image.
In the case of a render graph from Google Charts, we basically just give instructions on how the graph should be constructed to the client's browser in the form of code. The client's browser would download the JavaScript library from the closest CDN point and render the graph for us. This is much more lightweight than download the graphs from the server. A big upside is that if we are rendering lots of graphics, the JavaScript download is a one-time process so the overhead savings is greater when your page is graphics-heavy.
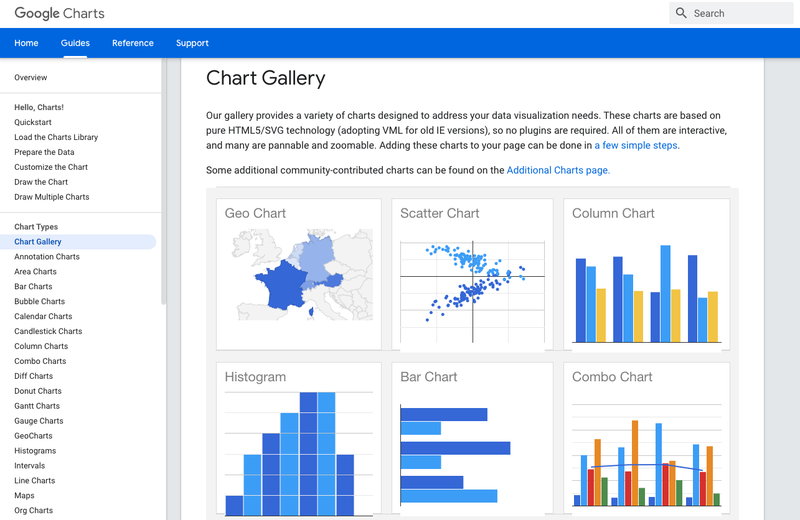
Why use it? Well, because it is free, powerful, and relatively easy to use. Check out the type of charts and graphs they offer in their gallery:
A Little Background on HTML
I assume we all have a little bit of an idea about how HTML works, if not, here is a good tutorial from W3Schools. Basically, HTML pages are a hierarchical form of tags of instructions for the browser on how to structure the page. Here is an example:
<!DOCTYPE html>
<html>
<head>
<title>Page Title</title>
</head>
<body>
<h1>This is a Heading</h1>
<p>This is a paragraph.</p>
</body>
</html>
The root of the page is the <html></html> tag pair which encloses all the other elements. The <head></head> tag includes meta data that are not displayed, the <body></body> tage consists of information to be displayed on the page. In this example, we have a <h1> header and a <p> paragraph.
This HTML page can be viewed as a DOM, which stands for Document Object Model. The DOM is a tree structure in which we can refer to the elements inside of the tree. This is commonly used by JavaScript to identify the parts it needs to change.
Loading JavaScript
HTML includes the <script> tag to load JavaScript. This can be referencing a separate file with the 'src' attribute or directly enclosed in between the tags. Many times people include the scripts at the bottom of the body because it gives the HTML page time to load before the script executes, this reduces error; other times people like to include it in the head section so the script loads first. I do not really have a preference and usually do it at the bottom of the page, however, since the Google Charts Example like this Pie Chart example loads it in the head section, that is what we will do. In fact, we will take that example directly and substitute some values that make it look more like network data as below:
<html>
 <head>
 <script type="text/javascript" src="https://www.gstatic.com/charts/loader.js"></script>
 <script type="text/javascript">
 google.charts.load('current', {'packages':['corechart']});
 google.charts.setOnLoadCallback(drawChart);

 function drawChart() {

 var data = google.visualization.arrayToDataTable([
 ['Protocol', 'Value'],
 ['TCP', 15],
 ['UDP', 30],
 ['ICMP', 45],
 ['Others', 10],
 ]);

 var options = {
 title: 'Network Protocols',
 pieStartAngle: 180,
 pieSliceText: 'label',
 slices: { 1: {offset: 0.1},
 },
 };
 var chart = new google.visualization.PieChart(document.getElementById('piechart'));
 chart.draw(data, options);
 }
 </script>
 </head>
 <body>
 <div id="piechart" style="width: 900px; height: 500px;"></div>
 </body>
</html>
If we load the page, this is what we will see:
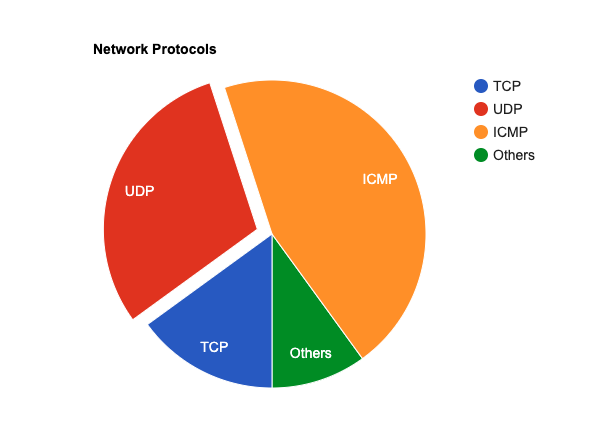
As mentioned, the page will only display what is in between the body tags. When we treat the page as a object, we refer to the particular element via HTML tag id. The <div id="piechart"> corresponds to the id where 'document.getElementById' is shown in line 26. The next line will call the chart.draw function with the data and options we specified.
This Google Chart is pretty simple and straight forward. In the next post, we will dig a bit deeper into the Vue JavaScript library to see how we can leverage this modern JavaScript library before we combine the two.
Happy Coding,
Eric